How we stack up
Click image below for easier viewing
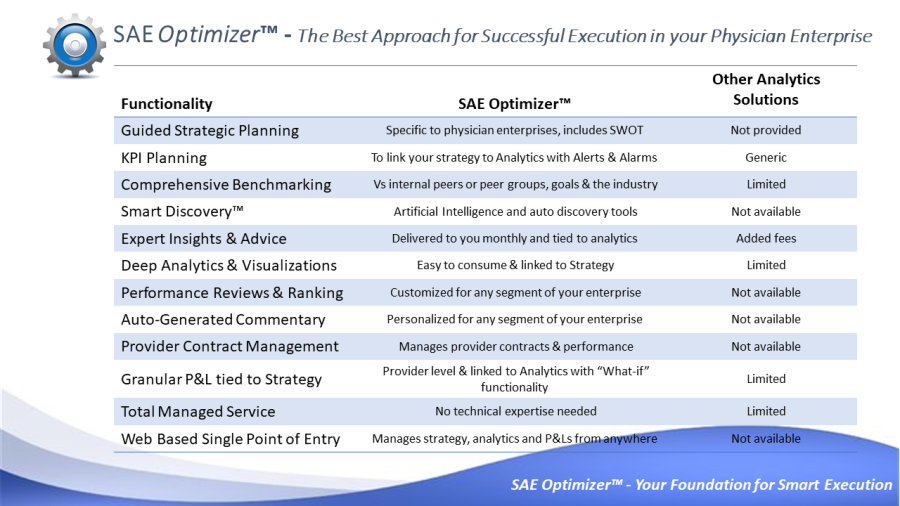
Feature Comparison
|
SAE Performance Solutions KPI Technology Suite |
SAE Performance Aligner™ |
SAE Optimizer™ |
SAE Optimizer+™ |
|
Max # of Providers |
100 |
200 |
Unlimited |
|
Max # of KPIs |
4 |
20 |
Unlimited |
|
Max # of Users |
2 |
49 |
Unlimited |
|
Data Sources |
4 |
10 |
25 |
|
Data Types (Quantitative/Qualitative) |
Quantitative |
Both |
Both |
|
Data Refresh |
N/A |
Monthly |
Monthly |
|
Training |
Included |
Included |
Included |
|
Custom Dashboards |
N/A |
Available |
Included |
|
Insights Navigator |
N/A |
Included |
Included |
|
Mobile Device Optimized |
Yes |
Yes |
Yes |
|
Subscription |
1 Time or Annual |
Annual |
Annual |
|
Pricing |
From $1000 |
Contact us |
Contact us |
|
Customization Options |
Contact us |
Contact us |
Contact us |
|
Analytics Functionality |
|||
|
Utilizes National Survey Data |
ü |
ü |
ü |
|
Tracks Trending |
ü |
ü |
ü |
|
Model "What-If Scenarios" |
ü |
ü |
ü |
|
Identifies Actions to Align Performance |
ü |
ü |
ü |
|
Tracks & Reports Actual vs Target |
ü |
ü |
ü |
|
Entity, Specialty & Individual Provider |
ü |
ü |
ü |
|
Insights Delivered to Your SAE Inbox |
- |
ü |
ü |
|
Artificial Intelligence Opportunity Discovery |
- |
ü |
ü |
|
Auto Discovery - Changing Trends |
- |
ü |
ü |
|
Auto Discovery - Opposing Trends |
- |
ü |
ü |
|
Identifies Alerts & Alarms Conditions |
- |
ü |
ü |
|
Balanced Scorecarding |
- |
ü |
ü |
|
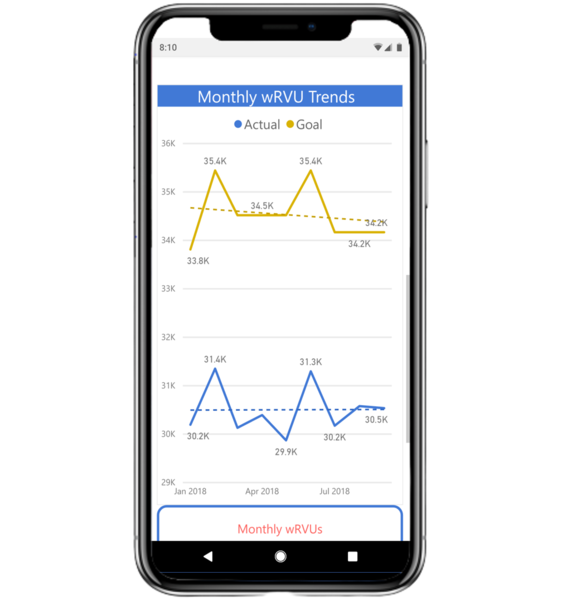
KPI Last Status & Trending |
- |
ü |
ü |
|
KPI Variances from Goal |
- |
ü |
ü |
|
Compare Provider KPIs Results |
- |
ü |
ü |
|
KPI Results Drilldown & Drill Through |
- |
ü |
ü |
|
Identifies Provider Outliers |
- |
ü |
ü |
|
Individual Provider Dashboards |
- |
ü |
ü |
|
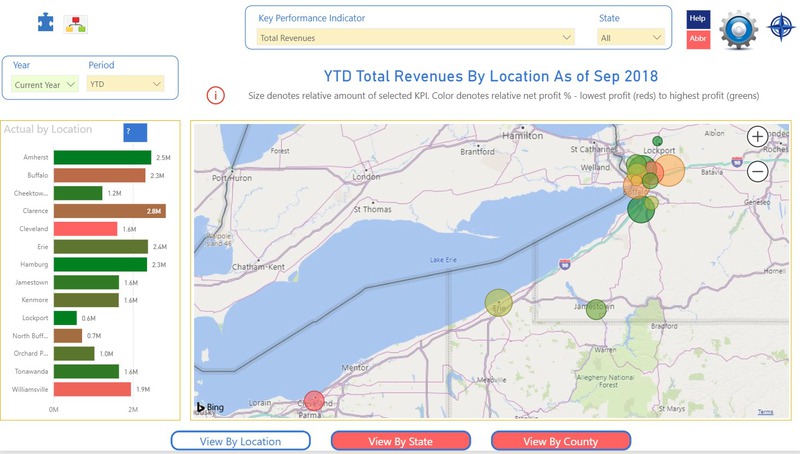
Geographic Mapping of Location Performance |
- |
ü |
ü |
|
Compare KPIs Among 2 Provider Subsets |
- |
ü |
ü |
|
Compare Amounts per Provider by Dimension |
- |
ü |
ü |
|
Compare 2 Provider Subsets by Credentials |
- |
ü |
ü |
|
Compare Top & Bottom Performers |
- |
ü |
ü |
|
P&L Execution Functionality |
|||
|
Provider Overall Performance Scoring/Ranking |
- |
- |
ü |
|
Provider Overall Performance Trending |
- |
- |
ü |
|
Custom Performance Reviews |
- |
- |
ü |
|
Expiring Provider Contracts |
- |
- |
ü |
|
Provider Level & Specialty P&L Statements |
- |
- |
ü |
|
Compare Profitability of Provider Subsets |
- |
- |
ü |
|
Compare Provider P&L Trends |
- |
- |
ü |
|
Compare P&Ls to National Benchmarks |
- |
- |
ü |
|
Compare P&Ls to Goals |
- |
- |
ü |
|
Cost of Care Comparisons |
- |
- |
ü |
|
Top & Bottom Performers by P&L Line |
- |
- |
ü |
|
Model P&L "What-If Scenarios" |
- |
- |
ü |
|
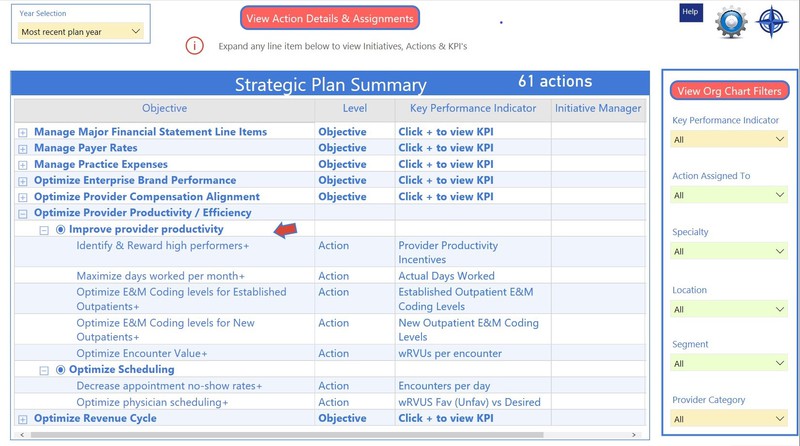
Strategy Functionality |
|||
|
Strategic Planning Development |
- |
- |
ü |
|
Strategy Foundation Statements |
- |
- |
ü |
|
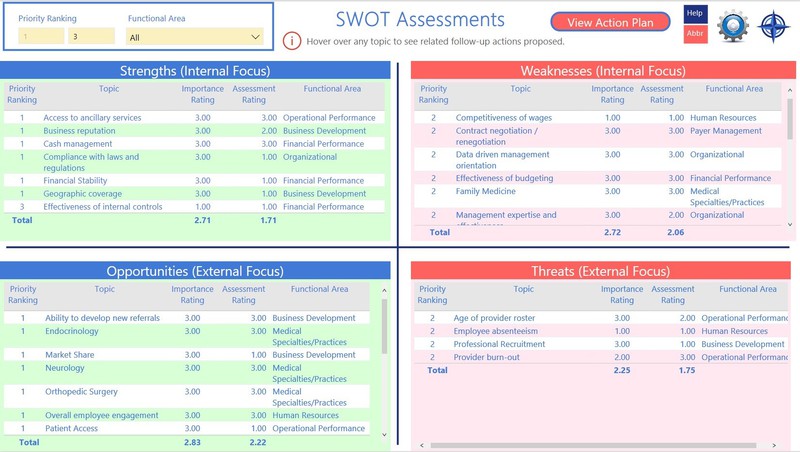
SWOT Assessment |
- |
- |
ü |
|
Strategic Initiative GANTT Chart of Timelines |
- |
- |
ü |
|
Standard and Custom Strategic Actions |
- |
- |
ü |
|
Linking of Strategic Plan to Analytics |
- |
- |
ü |
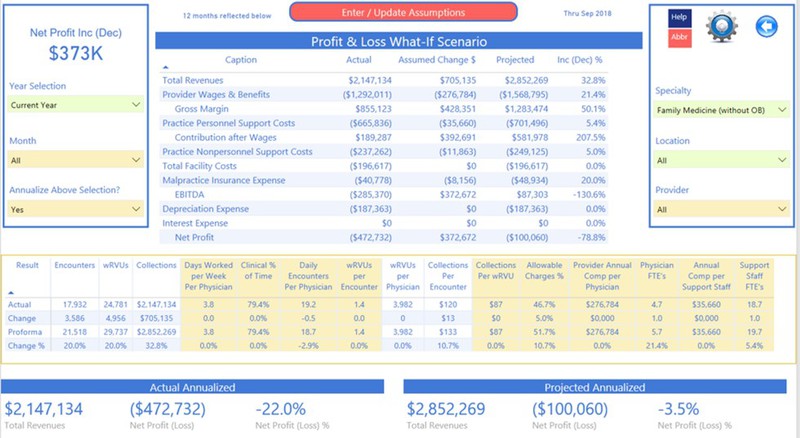
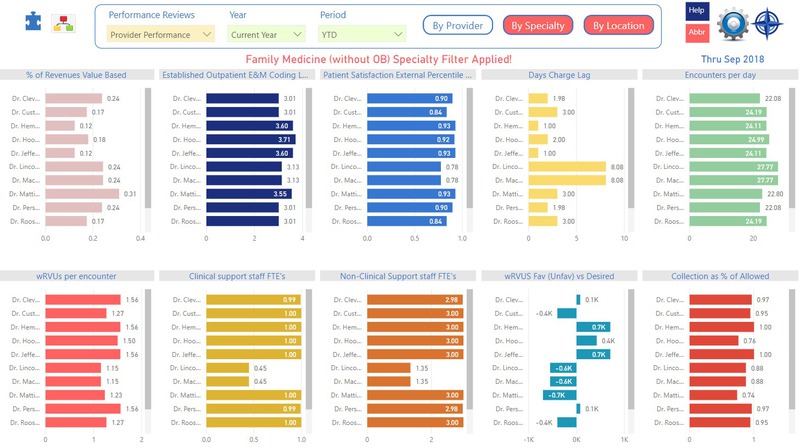
Sample Screenshots
Click images below to visualize the power of SAE Performance Solutions.
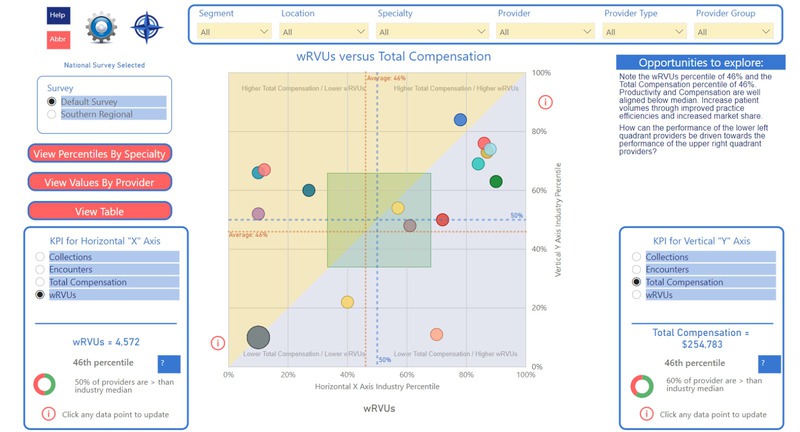


SAE Performance Solutions